The Circularity Assessment Protocol (CAP) was born out of an effort to define the concept of the circular economy in our cities and communities. While plastic pollution continues to be discussed at the highest levels of government, cities and communities are the front lines. CAP is conducted where requested, where a city is engaged in the process. Local knowledge and expertise are the foundation of the CAP, with additional data collected in partnership with CAP collaborators. Open data collection is an important part of the process, including leakage data. Once available, data trends across cities, countries and regions can also illuminate global narratives.
Data is power to communities and enterprising individuals who are recognized for their role in materials management through CAP but are often marginalized in society. CAP data can catalyze economic development through business opportunities and subsequent interventions. The issue of plastic pollution is not for outsiders to solve in other locations, but for communities to address by collaboratively collecting data to lead themselves through the context-sensitive design of their own desired circular economy. Communities are empowered by local and global CAP data to inform their decisions about what is working, or where and how to intervene to increase circularity. Communities that participate in CAP can better define resource needs and participate in knowledge exchange
Urban Ocean, a partnership of The Circulate Initiative, Resilient Cities Network, and Ocean Conservancy, works with city leaders to bring new ideas, partners and resources together to solve interrelated problems around materials management, including addressing key priorities such as public health and economic development. A critical step in the Urban Ocean process is the Gap Assessment, which maps challenges, risks, and vulnerabilities within materials management systems and helps to develop a unique, integrated picture of the materials and circular economy related challenges and opportunities faced by each city. The CAP, developed in the Circularity Informatics Lab (CIL) at the University of Georgia, was chosen as the ideal tool to deploy as part of the Urban Ocean Gap Assessment.
The interconnected nature of complex urban systems and the value of circular economy in building resilient cities was starkly evident when the COVID-19 pandemic began following the launch of the first Urban Ocean cohort of cities. As a team, CIL immediately transitioned to online global work, with our local implementation partners becoming even deeper collaborators, conducting all field work with virtual training. This allowed for embedded ownership of the data at the local level and ultimately a powerful network of collaborators and supporters across cities to drive scientifically informed decision making. Local implementation partners continued to work with the Urban Ocean team through stakeholder workshops and into the project identification l phase, as advocates for the science and key contributors in their own cities.
Urban Ocean and its partnerships provide an ideal platform to support resilient cities. CAP data can help guide interventions, create a baseline to measure success, and put essential data in the hands of the local community to drive change. We believe piecemeal solutions that are not contextually grounded are insufficient to create a systemic shift. Communities need to be involved, not just as stakeholders, but as the powerful change-makers they are.
e not contextually grounded are insufficient to create a systemic shift. Communities need to be involved, not just as stakeholders, but as the powerful change-makers they are.
— Jambeck Research Group, Circularity Informatics Lab, University of Georgia
Dr. Jenna Jambeck, Dr. Amy Brooks, Taylor Maddalene, Jennifer Mathis, Kathryn Youngblood
The Circularity Informatics Lab at the University of Georgia is committed to information sharing, data analytics, empowering communities, and systems change related to circular materials management.
King Mongkut's University of Technology Thonburi, Bangkok (KMUTT)
Authors:
Phorntip Limpichaisopon (KMUTT), Taylor Maddalene (CIL), Shelby Mendez (CIL), Jesse Sanchez (CIL), Kaylee Tam (CIL)
Contributors and Reviewers:
Jenna Jambeck (CIL), Shweta Nagarkar (RCities), Daniel Padilla Ochoa (OC)
Recommended Citation:
Circularity Informatics Lab, December 2024. Circularity Assessment: Bangkok, Thailand. University of Georgia, Athens, GA, USA.
Design/Layout:
Deeds Creative, Athens GA
Photo Credits:
Pages 31, 36, 38, 39, 44 — KMUTT
URL Links:
This publication contains links to external websites. Responsibility for the content of the listed external sites always lies with their respective publishers.
Maps:
The maps printed here are intended only for information purposes and in no way constitute recognition under international law of boundaries and territories. CIL accepts no responsibility for these maps being entirely up to date, correct, or complete. All liability for any damage, direct or indirect, resulting from their use is excluded.
On behalf of:
The Urban Ocean Program, a three-way cooperative partnership among The Circulate Initiative (TCI), Ocean Conservancy (OC), and Resilient Cities Network (RCities). Funding for this work was provided by OC.
Developed by the Circularity Informatics Lab at the University of Georgia (UGA), the Circularity Assessment Protocol (CAP) is a standardized assessment protocol to inform decision-makers through collecting community-level data on plastic usage and management. Grounded in materials flow and systems thinking concepts, the CAP uses a hub-and-spoke model to holistically characterize how consumer plastic flows into a community, is consumed, and flows out, either through waste management systems or leakage into the environment. The model, shown below, consists of seven spokes: input, community, material and product design, use, collection, end of cycle, and leakage. At the center, the system is driven by policy, economics and governance with key influencers including non-governmental organizations, industry, and government.
Between April and May 2024, a team from King Mongkut's University of Technology Thonburi (KMUTT), with guidance and support from the Circularity Informatics Lab, conducted fieldwork in the city of Bangkok, Thailand. The CAP was conducted with support from the city’s local government, the Chief Resilience Officer (a top-level advisor in the city that is responsible for leading, coordinating, and developing a city's resilience strategy and policy), and the larger Urban Ocean team. Fieldwork included product and packaging assessments in stores across the city; key stakeholder interviews with government, industry, and non-profit organizations; material type characterizations for consumer plastic items; cost analysis of reusable products and alternatives to plastic available in the city; visual audits of recycling contamination; identification of public waste and recycling collection bins; and litter transects in three categories of population activity. Key findings from each spoke are summarized in a subsequent table in this section.
Urban Ocean Program
Urban Ocean is a three-way partnership among The Circulate Initiative (TCI), Ocean Conservancy (OC), and Resilient Cities Network (RCities) that works with city leaders to bring new ideas, partners, and resources together to solve interrelated problems around waste management and plastic pollution. It aims to demonstrate how actions to improve waste management and recycling can provide holistic, resilient, and sustainable solutions that not only reduce ocean plastic pollution but also address key city priorities such as improving public health, promoting innovation, supporting economic development and job growth, and reducing greenhouse gas emissions through a capacity building and accelerator program for cities.
Bangkok is one of 12 cities in Urban Ocean to-date. The CAP is critical to the Opportunity Assessment phase of the Urban Ocean program, which involves a comprehensive Gap Assessment to map challenges, risks, and vulnerabilities within the cities’ critical waste management systems. The data gathered from the CAP in Bangkok contributed to a series of workshops where stakeholders discussed findings and developed a proposal(s) for interventions, as shown by the phases of the program below:
Get to know the partners:
Ocean Conservancy is working to protect the ocean from today’s greatest global challenges. Together with partners, they create science-based solutions for a healthy ocean and the wildlife and communities that depend on it. Since the formation of the International Coastal Cleanup in 1987, Ocean Conservancy has mobilized millions of volunteers to remove trash from beaches and waterways around the world while pioneering upstream solutions to the growing ocean plastics crisis. Ocean Conservancy invests in cutting-edge scientific research, implements on-the-ground projects, and works with conservationists, scientists, governments, the private sector, and members of the public to change the plastics paradigm. To learn more about our Trash Free Seas® program visit oceanconservancy.org/trashfreeseas, and follow Ocean Conservancy on Facebook, Twitter and Instagram.
The Circulate Initiative is a non-profit organization committed to solving the ocean plastic pollution challenge by supporting the incubation of circular, inclusive, and investible waste management and recycling systems in South and Southeast Asia. TCI achieves this by collaborating with key stakeholders across the sector, and by producing insights to support and accelerate investment and scale across the value chain. For more information, please visit: www.thecirculateinitiative.org
The Resilient Cities Network consists of member cities and Chief Resilience Officers from the former 100 Resilient Cities — pioneered by The Rockefeller Foundation program, sharing a common lens for holistic urban resilience. The Resilient Cities Network in partnership with its global community continues to deliver urban resilience through knowledge sharing, collaboration, and creative action, seeking to inspire, foster, and build holistic urban resilience around the world. For more information, please visit: www.resilientcitiesnetwork.org
Key Findings and Opportunities
INPUT
Findings:
87% of convenience product manufacturers and 75% of convenience product parent companies sampled were domestic to Thailand. All convenience products sampled had at least one manufacturer and parent company located within 20km of Bangkok. Tobacco products on average had the closest manufacturers and the farthest parent companies. Drinking water brands sampled on average had the closest parent companies and among the closest manufacturers, suggesting opportunities for Extended Producer Responsibility (EPR) and/or Deposit Return Scheme (DRS), which is currently overseen by the Government of Thailand but adopted and implemented at the city level. 98% of convenience product manufacturers sampled were located in Southeast Asia, mostly in Thailand.
Opportunities
Local and regional EPR schemes should be explored between parent companies and the governments of the ASEAN region, particularly among the most common local brands.
There may be opportunities for local deposit return schemes for brands with local or regional manufacturing locations.
Explore opportunities for private sector funding from popular local or regional/national parent companies/brands to reduce, reuse, recycle waste.
COMMUNITY
Findings:
14 interviews were conducted across 5 stakeholder groups, revealing several barriers to effective solid waste management and plastic pollution reduction in Bangkok, including a lack of coordinated leadership, a lack of relevant waste data, a lack of awareness around the issue, a highly transient tourist population, income-related stresses diverting attention from addressing plastic waste, and the diversity of languages in Bangkok increasing the difficulty of educational efforts. Stakeholders noted that efforts to increase awareness typically had a positive impact, especially corporate training on green policies and other corporate initiatives. Potential government interventions included subsidizing recycling costs, extended producer responsibility laws, bans on certain plastic types, increasing the cost of waste collection, polluter-pays laws, changing the waste collection rate from a flat fee, enacting laws requiring source separation of waste, shifting energy demand from fossil fuels to renewables, and enacting a waste tax.
Opportunities
Collaborate with the local private sector on waste management.
Build upon and more effectively communicate BMA’s efforts to reduce waste collection costs for households that successfully separate their recyclables.
Expand upon incentives, rewards, easy accessibility, and game-ifying opportunities like the EcoLife app and the BKK Green Maps.
Engage the public through social media efforts using the multiple languages used in Bangkok to reach a wide range of audiences with messaging.
PRODUCT DESIGN
Findings:
108 to-go items were sampled from 27 restaurants/food vendors, 85% of which were packaged in a plastic film or LDPE plastic bag. In addition, 93 convenience products were sampled from 27 stores. 52% of convenience products were packaged in multilayer plastic film (including 100% of chips and tobacco products) and 46% were packaged in PET (100% of beverages).
Opportunities
Problematic to-go items such as LDPE plastic bags should be targeted for substitution and transition to alternative materials that are recyclable in local markets or can be reused.
Lightweight, complex, and difficult-to-recycle packaging materials such as multilayer plastic or multi-material canisters should be prioritized for redesign, EPR schemes, deposit models, and other interventions to minimize their likelihood of escaping the waste stream and ending up in the environment.
Encourage transition towards organic to-go materials in restaurants by highlighting them in the community / providing incentives.
USE
Findings:
115 single-use plastic alternative items were identified across 27 convenience and grocery stores. The majority (68%) were bulk options, all of which were also found to be the most cost-effective options for products. The average cost across all categories of alternative use types was lower than that of comparable single-use plastic items. 96% of all 27 stores surveyed distributed predominantly single-use plastic shopping bags, with an average cost of 2 baht (among those that charged for them [56% of stores]). 14% of stores offered reusable alternatives to single-use plastic shopping bags, with an average cost of 33 baht.
Opportunities
Reduce single-use plastic by encouraging the use of reusable straws, stainless steel bottles, travel cups, etc. — especially in restaurants and food vendors — either through policy/incentives, city-based communication campaigns, or both.
Stores should explore incentives for customers to bring reusable bags, particularly those that can simultaneously save costs for the stores.
The local government should explore policy options and incentives to discourage single-use plastic shopping bags.
Stores, consumers, marketers, and local government should capitalize on cost-effective bulk, refillable, and alternative options already present in the city, and expand where there is demand and opportunity.
COLLECTION
Findings:
There is currently no formal household recycling collection infrastructure, yet there is a very active informal recycling sector. The city is investing in drop-off locations in the city for recycling, but the coloring/coding of the bins is not consistent and there is confusion. There is an opportunity to incorporate and center informal sector workers who know the most about the types of materials they encounter and who may lose their livelihoods if recycling becomes more institutionalized. Small pieces of plastic waste are light and can still fly away even after they go into the bin. Some households do not pay for garbage collection (the exact quantity/percentage is not known). Officials have to pick up trash anyway.
Opportunities
Encourage households and communities to separate recyclables at source so that they are not contaminated with food/organic waste and can be recycled.
Provide accessible recycling drop-off locations so they are common across the city.
Incorporate and center informal sector workers who know the most about the types of materials they encounter and who may lose their livelihoods if recycling becomes more institutionalized.
Increase the amount of food waste being sent to the composting facility, as it could divert up to 44% of MSW — this could be accomplished through collection or education efforts.
Explore alternatives in dense settlements where access to households for waste collection is a concern to avoid open dumping in the canals/sub-canals.
END OF CYCLE
Findings:
Given that certain areas receive curbside waste collection before waste is taken to transfer stations, there are opportunities for multiple points of intervention for material separation — from household to collection point, during collection, and at the transfer stations. Lower income communities tend to live in areas with roads that are difficult for waste trucks to navigate, resulting in residents participating in open dumping. There may be an opportunity to think about how public infrastructure (road access), among other social assistance, may improve resident participation in waste management efforts. Further research could be done on barriers to waste management participation across classes, as well as how low-income populations in Bangkok are disproportionately tasked with disposing of waste.
Opportunities
Raise the price of recycled waste (enhance end-markets and increase the quality of sorted waste) — e.g., there may be an opportunity to increase recycling if the waste dealer shops were all licensed, allowing for an increased flow of recycled materials from the informal to the formal sector.
Need waste management pathways for all waste streams.
Multiple points of intervention exist to enhance material separation — from household to collection point, during collection, and at the transfer stations.
Linking public infrastructure (e.g., road access) and other social assistance to opportunities to improve participation in waste collection and management, where feasible and considering creative solutions for densely populated settlement areas where access is an issue.
Conduct further research on barriers to waste management participation, as well as how low-income populations in Bangkok are disproportionately tasked with disposing of waste. This could include exploring non-conventional methods of collection, such as cargo bicycles, push carts, or other participatory methods using designated drop-off zones.
LEAKAGE
Findings:
1,888 litter items were documented in the city, 40% of which were food-related packaging and 32% were tobacco products. The top five most common litter items were plastic cigar/cigarillo tips, straws, plastic food wrappers, plastic bottles, and plastic bags. Litter density was highest in low population areas and highest in middle population areas, though overall litter density was lower on average compared to other UO cities. Common plastic items (including food plastic, plastic fragments, other plastic, PPE, and personal care items) comprised around 52% of litter items, which is relatively high compared to other UO cities.
Opportunities
Food-related packaging should match local infrastructure (e.g., incentivizing recyclable or compostable items), with support from local policy and incentives for businesses.
Explore increasing cigarette/tobacco collection bins across the city (and/or in targeted areas where tobacco litter rates are particularly high) and encourage their proper disposal through education campaigns and increased disposal infrastructure.
Encourage redesign so that bottle caps are tethered to bottles in order to eliminate bottle caps from the top 10 litter items.
Use ambient population density and other societal indicators to determine the best locations for drop-off centers to decrease leakage, starting with low-population areas that had the highest litter densities.
Strengths
Success of previous voluntary awareness campaigns around plastic reduction, particularly corporate training
Strong local and regional manufacturing opportunities
Interest among local stakeholders for additional and innovative policy interventions, such as Polluter Pays Principles and Extended Producer Responsibility
Active civil society and innovative tools/technologies to reduce waste and enhance recycling in the city (BKK Green Life, EcoLife App, Water Refill Map, Jak Reward Technology, etc.)
Several organizations operating in Bangkok focused on capturing waste from waterways (TerraCycle Thai Foundation, The Ocean Cleanup)
Presence and affordability of bulk and refill purchasing options in the city
Thailand’s Roadmap on Plastic Waste Management 2018-2030
BMA’s existing incentive schemes to promote waste separation and recycling through lower disposal costs for effective sorting
Glossary of Acronyms and Abbreviations
+
CAP — Circularity Assessment Protocol
CE — Circular Economy
CIL — Circularity Informatics Lab
C&D — Construction and Demolition Material
DRS — Deposit Return Scheme
DTDC — Door-to-door Collection
EPS — Expanded Polystyrene
EPR — Extended Producer Responsibility
FMCG — Fast-Moving Consumer Goods
HDPE — High-Density Polyethylene
GDP — Gross Domestic Product
KMUTT — King Mongkut's University of Technology Thonburi
LIP — Local Implementing Partner
MPs — Microplastics
MSW — Municipal Solid Waste
MSWM — Municipal Solid Waste Management
NGO — Non-Governmental Organization
NMI — New Materials Institute
OC — Ocean Conservancy
PE — Polyethylene
PET — Polyethylene terephthalate
PP — Polypropylene
PPE — Personal Protective Equipment
PRO — Producer Responsibility Organization
PS — Polystyrene
RCities — Resilient Cities Network
SWM — Solid Waste Management
TCI — The Circulate Initiative
TPD — Tons Per Day
UGA — University of Georgia
Introduction
+
Background
Modern Bangkok boasts significant industries in tourism, finance, banking, trade, and commerce (New World Encyclopedia, 2023). In 2019, Thailand had 22.7 million international visitors, with 3,930,800 tourists arriving in December alone. However, the influx of tourists poses a large issue with cigarette litter and increased waste (Ministry of Tourism & Sports, Thailand, 2024). Another challenge to effective waste management and general waste operations in the city is posed by the pronounced income inequality among Bangkok's residents. There is a contrast between various populations in Bangkok, from the relatively unskilled lower-income immigrants from rural provinces and neighboring countries to wealthier skilled workers like government officials, middle-class professionals, business people, and retired foreigners (New World Encyclopedia, 2023). In terms of housing infrastructure, as of 2022, 20% of the population in the Bangkok metropolitan area of Thailand lived in informal housing, commonly referred to as slums (Nguyen & Pattanrsi, 2022). This can also pose a challenge to waste management as those areas can be difficult to physically access for waste collection and can lack infrastructure for waste disposal.
Bangkok is a major economic, cultural, and social hub in the Asian Pacific region. As a large and ever-growing city, it remains critical to implement effective waste management practices for its residents and commercial operations alike. There is a significant opportunity to optimize circularity within the city and as a model for the region.
Methodology
The Circularity Informatics Lab at the University of Georgia has developed a Circularity Assessment Protocol (CAP), which is a standardized assessment protocol used to collect community-level data to inform decision-makers. The CAP characterizes seven community components:
Inputs — What products are sold in the community, and where do they originate?
Community — What conversations are happening, and what are the stakeholders’ attitudes and perceptions?
Product design — What materials, formats, and innovations are found in products, particularly packaging?
Use — What are the community trends around the use and reuse of product types?
Collection — How much and what types of waste are generated? How much is collected, and what infrastructure exists?
End-of-cycle — How is waste disposed? What is the fate of waste once it is properly discarded? How is it treated?
Leakage — What waste ends up in the environment? How and why is it getting there?
Various influencing factors drive this system including governance, economics, policy, and legislation (e.g., bans, taxes). Furthermore, multiple stakeholders exist at every level of the CAP, influencing the complex system, and these include the public, government, industry, non-profit and non-governmental organizations (NGOs), consumers, and academia. While the hub and spoke model illustrates the CAP, it is a complex system with components inherently interconnected to each other and life cycle impacts beyond each spoke. The CAP is a framework approach to the flow of materials, in this case focusing on plastic and packaging, and the quantity and characterization of leakage from this sector will be characterized during litter assessments that can inform upstream interventions in the rest of the systems model. As of June 2024, CAP has been conducted in 56 cities in 16 countries.
This report documents work conducted by the Circularity Informatics Lab at the University of Georgia (UGA) and KMUTT as part of the Urban Ocean program. Background information and a literature review were conducted in January 2024. Fieldwork was conducted from April – May 2024. The CAP report is split into the following sections, which include results and discussion of each: Input, Community, Product Design, Use, Collection, End of Cycle, and Leakage, followed by Opportunities to support the forthcoming Opportunity Assessment Workshops for Urban Ocean cities.
Sampling Strategy
In order to randomly sample various locations in a city, the CAP typically identifies a 10 x 10km area over the city (with the center of the city in the center of the area). In this area, the ambient population is sectioned into tertiles (three groups) (Figure 1). Ambient population count can be described as “where people go” and “societal activity” — it is not population density of where people live. These three areas typically form samples of different land uses, etc.
Figure 1: Map of CAP Sample Sites
Three 1 x 1km arIn Bangkok, three 1 x 1 km areas for surveying are randomly selected within each population tertile using NOAA’s Sampling Design Tool, resulting in a total of nine 1km2 areas for surveying.
CAP Results
:
Input
+
o get a snapshot of the characterization, scope, and source of common plastic packaged items that are entering Bangkok, samples of common convenience items, also called fast-moving consumer goods (FMCG), were sampled within nine 1km2 transects in Bangkok — three within each tertile (relative groupings of high, medium, and low) of the population count. The LIP selected 3 convenience or grocery shops to sample within each 1km2 transect area. For each shop, the LIP collected the most popular brands of beverages, candy, chips, and tobacco products (including chewing tobacco, cigarettes, and sachets). The most popular brand was determined based on the brand most frequently observed upon shelf inventories and/or the shopkeeper’s input. In total, 93 unique brands of convenience products were collected and sampled, including 29 beverages, 29 candy, 19 chips, 3 tobacco, and 13 water products. Sample of identical brands were not collected multiple times, even when present in multiple stores.
For each of the products documented, the type of packaging (including polymer, if possible), the brand, and the parent company were noted. From the packaging, the team determined the manufacturing location from locations listed on product packaging or desktop research, as well as the headquarters location for the parent company of the brand (largely determined by desktop research). Manufacturer and parent company distances (Table 1) are intended to estimate the distance in kilometers between the city and the manufacturer or parent company of each product, which each are accompanied by their own set of potential leverage points and opportunities in optimizing circularity in the city and region.
Top brands of each category are based on visual assessment of shelf space in a store, conversations with shopkeepers, and repeated occurrence across stores. These top brands consisted of the following:
Beverages: Pepsi, Coca-Cola, and Fanta
Chips: Lay’s, PR Big Bag, and Testo
Water: Crystal, Namthip, and Nestle
Tobacco Products: SMS, L&M, and Camel
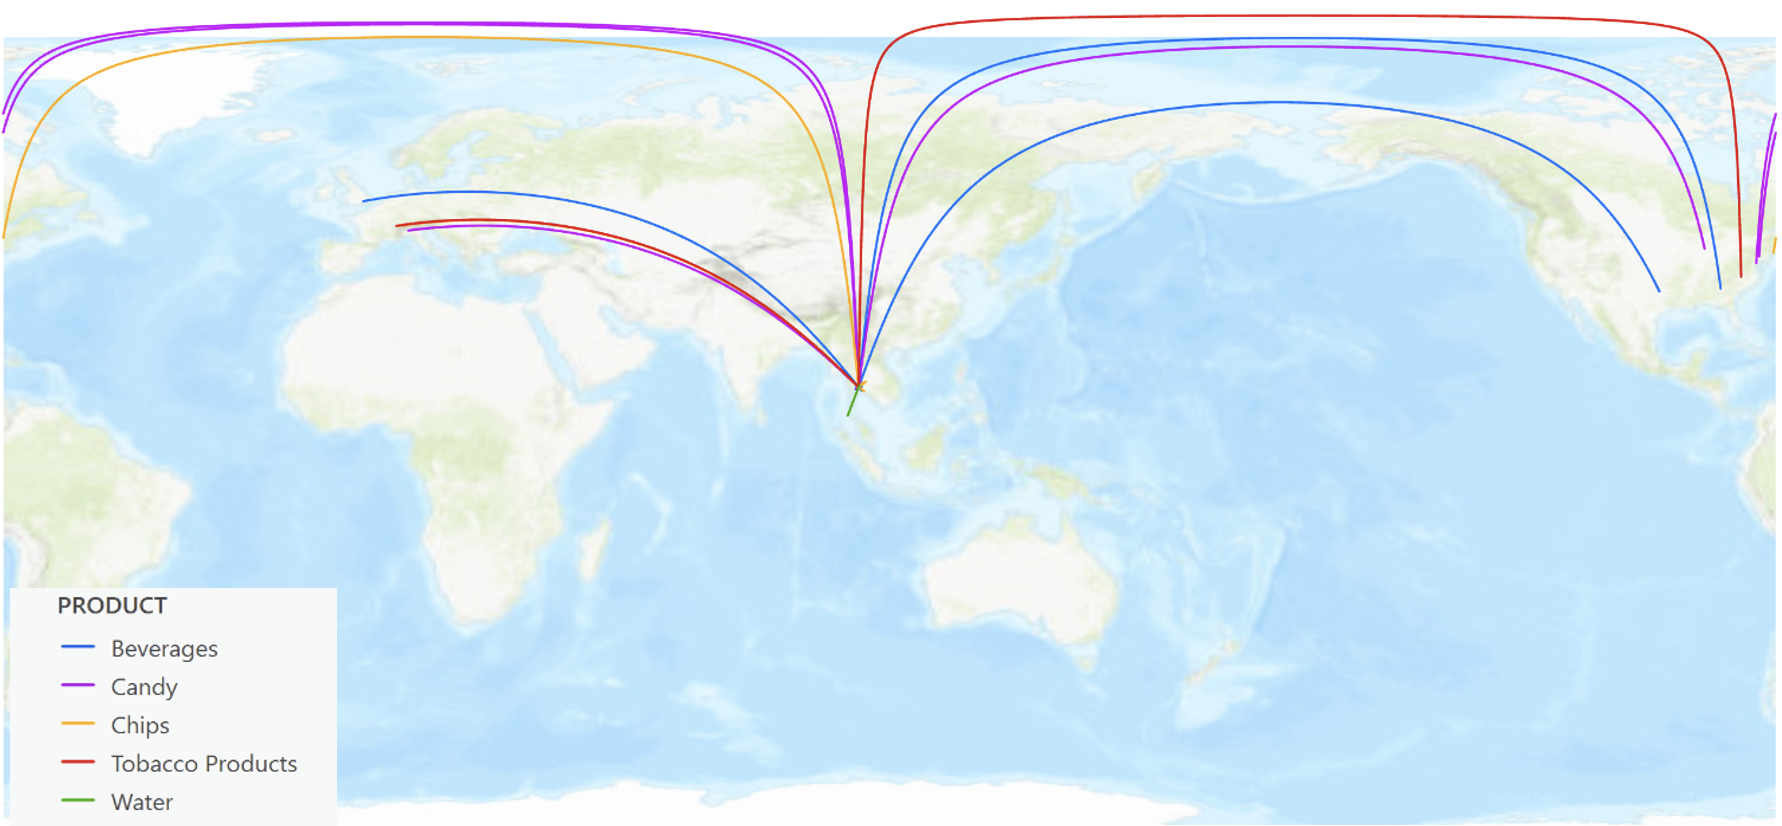
From researching manufacturers, 87% of sampled convenience product manufacturers and 75% of convenience product parent companies were domestic to Thailand (Figure 2, Figure 3, Figure 4). Additionally, all the sampled convenience products had at least one manufacturer and parent company located within 20 kilometers of Bangkok. Out of all the categories of convenience products, tobacco products had the closest manufacturers, but tobacco also had the furthest parent company headquarters. Water brands sampled had the closest average distance from parent companies and one of the closest average distances for manufacturers (Table 1). Overall, 98% of all the convenience products sampled were located in Southeast Asia, mostly in Thailand. This is relevant as the close manufacturing proximity could be promising for Extended Producer Responsibility (EPR) and/or Deposit Return Scheme (DRS) programs in the region.
Table 1: Distances from sampled stores to convenience products parent company and manufacturing facilities
Note: Distances were projected using an Azimuthal Equidistant projection. Values have been rounded to the nearest km.
A majority of the products in all categories were manufactured domestically in Thailand (Figure 2, Figure 3, Table 2). For beverages, only one of the brands sampled was manufactured in another country, Indonesia (about 3% of beverages). Candy had the most foreign manufacturers out of all the categories with 34% manufactured in a foreign country. Indonesia accounts for 14% of foreign manufactured candy and Malaysia 7%; Of the sampled brands, China, the Philippines, Singapore, and Vietnam all had one candy brand manufactured within their borders. Chips had one product manufactured in Germany, the rest of the samples collected were manufactured domestically. All Tobacco and Water products were manufactured in Thailand.
Figure 2: Map of Manufacturer Locations by Convenience Product Type
Figure 3: Map of Manufacturer Locations by Convenience Product Type (zoomed in)
Figure 4: Map of Parent Company Locations by Convenience Product Type
Generally, EPR legislation requires packaging producers to join a producer responsibility organization (PRO), or stakeholder organization, to develop a plan and manage the program (Sustainable Packaging Coalition 2022). EPR can take many forms, but common approaches throughout the world include product-take-back and deposit-refund schemes as well as waste collection and take-back guarantees (UNEP 2018). EPR can be a requirement of the companies doing business in a state or country no matter where products are manufactured, or companies are located. A full list of parent companies and manufacturers documented across the Bangkok product surveys is available in the Appendix.
Table 2: Domestic products and materials produced or manufactured in Thailand
With an abundance of local and regional manufacturing locations associated with popular consumer products in Bangkok, there are opportunities for interventions, such as deposit-return schemes or extended producer responsibility, to ensure that the packaging of those items are collected and managed. Similarly, manufacturers should explore alternative packaging designs, especially for low-value SUP items, as well as private sector and corporate social responsibility funding that may be available to BMA for waste management. It would be valuable to collaborate with regional bottling companies to identify where drop-off locations may be possible for deposit-return schemes, such as at popular convenience or grocery stores. Conversations could be had between local and regional governance bodies and popular brands and manufacturers to explore these opportunities.
No items found.
CAP Results
:
Community
+
CAP Results: Community
+
To understand current attitudes and perceptions of plastic waste, semi-structured interviews were conducted by the LIP with 14 key stakeholders (Table 3). Among those interviewed, three were government employees, four were NGOs, two were industry workers, two were social businesses (locally-focused social enterprises related to waste, recycling, and community engagement), and three were from academia (Table 3).
Table 3: List of Stakeholders Interviewed for CAP
Most stakeholders interviewed saw plastic pollution as a major problem, especially when it comes to water pollution. They noted the foul smell, and probable health impacts, emitted from open burning of waste and plastic and the negative appearance of plastic waste in the environment. Several people observe problems with plastic waste clogging drainage pipes in marketplaces and walkways and causing flooding. The biggest concern, however, was the impact of plastic pollution on aquatic wildlife and, eventually, human health.
“Plastic waste is a problem for communities because it causes toxic effects that damage mental health. The stench of chemicals from burning plastic is destroying the world, releasing toxic gases into the atmosphere … It affects the sources of aquatic animals that eat microplastics. In the near future, it may not be possible to eat aquatic animals because they are full of microplastics.”
— Social Business
“Plastic waste pollution is a problem for communities: waste management is difficult, incinerators are insufficient, if incinerated, air pollution will occur … If it goes into the water, it becomes microplastics in water sources. Some of it is food for aquatic animals. People eat aquatic animals, causing microplastics to stay in various tissues of the body. It is marine pollution, causing water pollution and clogging of water pipes, affecting marine animals.”
— Industry
“Plastic pollution is a big problem, affecting communities because they live near water sources. When fish are caught, plastic curry bags are often found. There is a significant amount of trash in the canals, making the water dirty. When storms blow in, they also carry plastic trash. When plastic trash falls into water sources, it is harder to collect. If plastic cups or plastic bags are left out, they can easily fly away and fall into the canals.”
— NGO
Single-use food packaging, in particular, was mentioned by many stakeholders as a major contributor to plastic pollution. Items such as single-use plastic bags, cups, and containers were said to have low recycling value, an unnecessary number of plastic layers, and a high probability of being disposed of improperly.
“I would like people to bring their own food containers, such as lunch boxes and food boxes, to put food from restaurants because food bags, single-use plastic cups, and plastic bags (curry bags) that are plastic from food packaging are a large part of the waste but have low recycling value and are difficult to clean.”
— Social Business
“If I had a magic wand, I would want restaurants to reduce the use of single-use plastics because fishermen often leave their food bags out. When the wind blows, the plastic bags / lunch boxes will fly away. If they are hung on a tree branch, they forget to pick them up.”
— NGO
“The private sector’s problem is the production process that forces plastic packaging on consumers unnecessarily, such as food packaging and disposable containers that are packaged with multiple layers of plastic more than necessary because they want to create a sense of care for hygiene, so there are multiple layers of packaging, such as wrapping coconuts with plastic film, bananas sold in convenience stores are wrapped in plastic, or even giving out plastic straws or plastic forks and spoons without asking consumers if they want them first, resulting in a large amount of plastic waste from packaging and eating utensils.”
— NGO
Stakeholders also noted several barriers to effective solid waste management and recycling. The diversity of languages, a lack of coordinated leadership, and low-income stressors make effective waste management practices like reducing, transporting, and separating waste difficult. Combined with the high volume of waste experienced in urban populations, high-quality waste disposal can be difficult to access for some.
“It depends on the community leader or president. If they do not come in to seriously oversee and manage, there will be no concrete results in proper waste separation and management.”
— Government
“Barriers like low income make it difficult to do other things, even good things, such as taking care of the environment or reducing plastic waste, because earning a living is the most important thing in every day.”
— Industry
“I wish a magic wand would be used to separate the waste. Many countries have systems that are not very complicated, such as Taiwan and England.”
— Social Business
The community had conflicting opinions about what led to this problem; some stakeholders believed that a lack of knowledge and awareness around plastic pollution was to blame for resident’s lack of individual actions:
“City people don't see the environmental problems directly because there is a daily garbage collection to prevent them from piling up.”
— Social Business
“The problem is mass media not giving importance to communicating environmental issues to the general public. Although there are a number of environmental communicators, there are only a handful of followers, most of whom are already interested in environmental issues. As for the mainstream media on free TV or digital TV, there is still a lack of communication on knowledge of simple waste management methods for the general public, including the environmental issues that Thailand and the world are facing… Most people in big cities and the country still lack awareness of this issue.”
— NGO
While others believed it was a lack of care for the environment in the face of convenience:
“Many shops still use plastic bags for customers to carry their items because they are convenient and cheap. People are aware of the dangers of plastic waste pollution, but they do not care. They focus on their own convenience and do not care about how others feel. For example, foreign workers who come to work in the city are hidden populations, not locals who love their hometown. As for tenants, they temporarily stay and soon move to another place.”
— Government
“Everyone knows that plastic is bad and we need to use less of it. There are behavioral changes that conflict with convenience, making it very difficult.”
— Academia
However, most stakeholders noted that increased awareness seems to have a positive impact on people’s behaviors. There’s been an increase in demand from customers for eco-conscious waste disposal options and a move away from single-use plastic items; where customers do still use single-use plastic items, there’s a demand for less plastic to be used in product packaging.
“An example of the positive impact created by the organization 5-6 years ago, a man who attended the seminar organized by the association was inspired and took the knowledge to further develop a circular economy business… which is a one-stop service solution dedicated to maximizing the value of surplus fabrics and minimizing waste in the fashion industry.”
— NGO
“People are more aware of plastic pollution in the community. From my experience dropping off my waste at N15, I noticed that N15 would bring in bigger trucks to collect the waste that was sent to be burned for energy, reflecting that people are more aware … From the perspective of [our] store, it has been noticed that people are becoming more environmentally conscious, making more of an effort to carry their own straws, cups, tote bags and using more refills.”
— Social Business
“The amount of plastic used is currently decreasing. Many projects reduce the use of plastic. For example, a bottle used to weigh 50 grams. Customers want to reduce it to only 30 or 40 grams.”
— Industry
Currently, it seems that private businesses and other organizations are taking the lead on reducing plastic waste, as many of the government initiatives to reduce plastic pollution have stalled since COVID restricted the government’s ability to enforce pollution laws.
“There used to be a waste reduction KPI [key performance indicator] [through the University’s Green Office for department and faculty], but it disappeared during COVID.”
— Academia
“Another initiative to help plastic reduction is being done by Grace, a company that produces food packaging from waste materials such as bagasse, a byproduct of sugar production, and bamboo pulp. The company is therefore proactive in reducing the production of plastic containers.”
— Industry
Several stakeholders pointed out the positive impacts of various corporate initiatives, from increased access to plastic alternatives to waste reduction and separation to educational training for employees. Others felt local businesses and media organizations could be doing more to reduce plastic pollution by increasing advocacy and avoiding the sale of single-use plastics.
“Industries that respond to waste management alternatives, such as Tipco Asphalt, are factories that have received Green Industry certification by creating a green corporate culture, from factory managers to operational levels.”
— Social Business
“Private sector actors, such as 7Eleven, a convenience store that stopped giving out plastic bags to customers, has helped reduce the amount of plastic bags enormously.”
— Government
“The media should be a serious and intensive voice to communicate the plastic waste problem to create awareness among the general public, especially those influencers with a large following … Restaurants that offer dine-in service should stop using single-use plastic.”
— NGO
Stakeholders had a variety of ideas about what actions the government could take to improve the plastic waste management of the city, both upstream and downstream.
“The government should subsidize costs that no one wants to pay, such as the price of recycled plastic which is currently higher than virgin plastic.”
— Industry
“The government should be serious in enacting laws such as EPR, banning OXO [oxo-degradable] plastic, using economic tools to calculate and inform the public of the impact on the country and the world, such as increasing the cost of household waste to make the public aware of reducing and separating waste.”
— NGO
“We should pass the Polluters Pays Principle law by thinking of a structure and system for who will collect the money.”
— Academia
As of now, however, stakeholders say there’s a lack of sufficient data surrounding the amount of waste entering the environment and the costs of pollution prevention, leading to government inaction and a potential spread of misinformation.
“Data on the amount of waste collected has not been collected, and only cleaning [e.g., cleaning of litter and general waste] can be done.”
— Government
“As for the EPR law, it has not progressed as much as it should. There is a lack of serious calculation of management costs and no figures for the higher expenses of the public if the EPR law is enforced. This has led to the phrase “the public will suffer when the price of products increases because manufacturing companies are forced to use the EPR.””
— NGO
Community-Based Organizations in Bangkok
Bangkok is also home to many community and non-profit groups that are working to make the city more sustainable and environmentally friendly. For example, Bangkok Greenie has put together a Thailand Green Map that shows recycling drop-off locations, repair shops, eco-friendly options for food and convenience shopping, bulk and refill stations, second-hand clothing stores, sustainable accommodations, and other green options across the city (Figure 5).
Figure 5: BKK Green Map
The EcoLife App is another example of a community-led initiative that makes eco-conscious decision-making easier, rewarding, and fun for consumers in Bangkok (Figure 6). Separating waste and reducing plastic are among the highest engagement points for users of the app to date.
Figure 6: EcoLife App
The Environmental Justice Foundation, in partnership with the Norwegian Retailers Environment Fund and the Bangkok Metropolitan Administration, is another NGO fighting plastic pollution in the Bangkok area with their “Bottle Free Seas” initiative. Their focus is creating a network of free water refill stations to encourage the use of reusable water bottles instead of single-use bottles while also providing accessible, clean drinking water to the public for free. This includes the creation of a public map showing the locations of each refill station they have established (Figure 7).
Figure 7: Water refill station map for Bangkok
In addition, a 2024 study out of the Stockholm Environment Institute in Bangkok and the Free University of Berlin in Germany conducted interviews with waste pickers in Bangkok to better understand their crucial role in the recycling economy given the lack of systematic, state-funded recycling infrastructure in the area (Adelina et al., 2024). The study found that waste pickers hold highly specialized spatial-temporal knowledge of their city’s waste generation, knowing where and when to find certain quantities and types of waste within their informal “territories” and forming close relationships with shopkeepers and households within their communities. While many waste pickers are proud of the role they play in society and the essential services they provide to the city, they also feel uncomfortable being watched while working and will avoid collecting recyclable waste in areas with high foot traffic or from homes where they felt they’d be watched. There were also noticeable negative socio-economic influences at play in the work of salengs; traffic law enforcers and higher income neighborhoods would often bar waste pickers from their work, claiming they were obstructing traffic or accusing them of stealing. Female waste pickers also reported lower wages and more restrictions on range and hours for their work– women were less likely to work at night and more likely to work near where their children live or work with their children. The researchers also highlighted the need for waste separation at source, noting that much of the waste is contaminated with human-produced biohazards that pose a risk to waste pickers and prevent waste in certain areas from being picked and recycled. Informal recyclers and the junk shops they partner with form much of Bangkok’s recycling infrastructure due to a lack of existing state-funding infrastructure and little economic incentive for large-scale corporate funded recycling programs.
From these stakeholder interviews and other sources, we found there are several barriers to effective solid waste management and plastic pollution reduction in Bangkok. These include a lack of coordinated systems, lack of relevant waste data, lack of awareness around the issue, the presence of income-related stresses diverting attention from plastic waste, and the diversity of languages in Bangkok making educational outreach difficult. The affordable cost of virgin plastics in comparison to recycled plastic also forms a notable barrier to establishing a large-scale formal recycling system in the city. However, many stakeholders noted that efforts to increase awareness typically had a positive impact, especially corporate training on green policies and other corporate initiatives. They believed that increased corporate and governmental actions to reduce and separate waste and prevent pollution would be the most effective ways to address the prevalent pollution affecting the city’s streets and waterways. They also felt that, through economic interventions, the government could help create financial incentives to expand local recycling programs. Some stakeholders suggested that corporate media make solid waste pollution and management a priority topic, while others suggested that businesses in the food service industry stop using single-use plastics altogether.
There was a variety of thoughts on the best governmental policies to address the problem, including subsidizing recycling costs, extended producer responsibility laws, bans on certain plastic types, increasing the cost of waste collection, polluter-pays laws, changing the waste collection rate from a flat fee, enacting laws requiring source separation of waste, shifting energy demand from fossil fuels to renewables, and enacting a waste tax.
Collectively, this information from the community indicates that Bangkok is in a good position to use a variety of different approaches to address plastic pollution and create meaningful change from both a governmental and corporate perspective.
No items found.
CAP Results
:
Product Design
+
CAP Results: Product Design
+
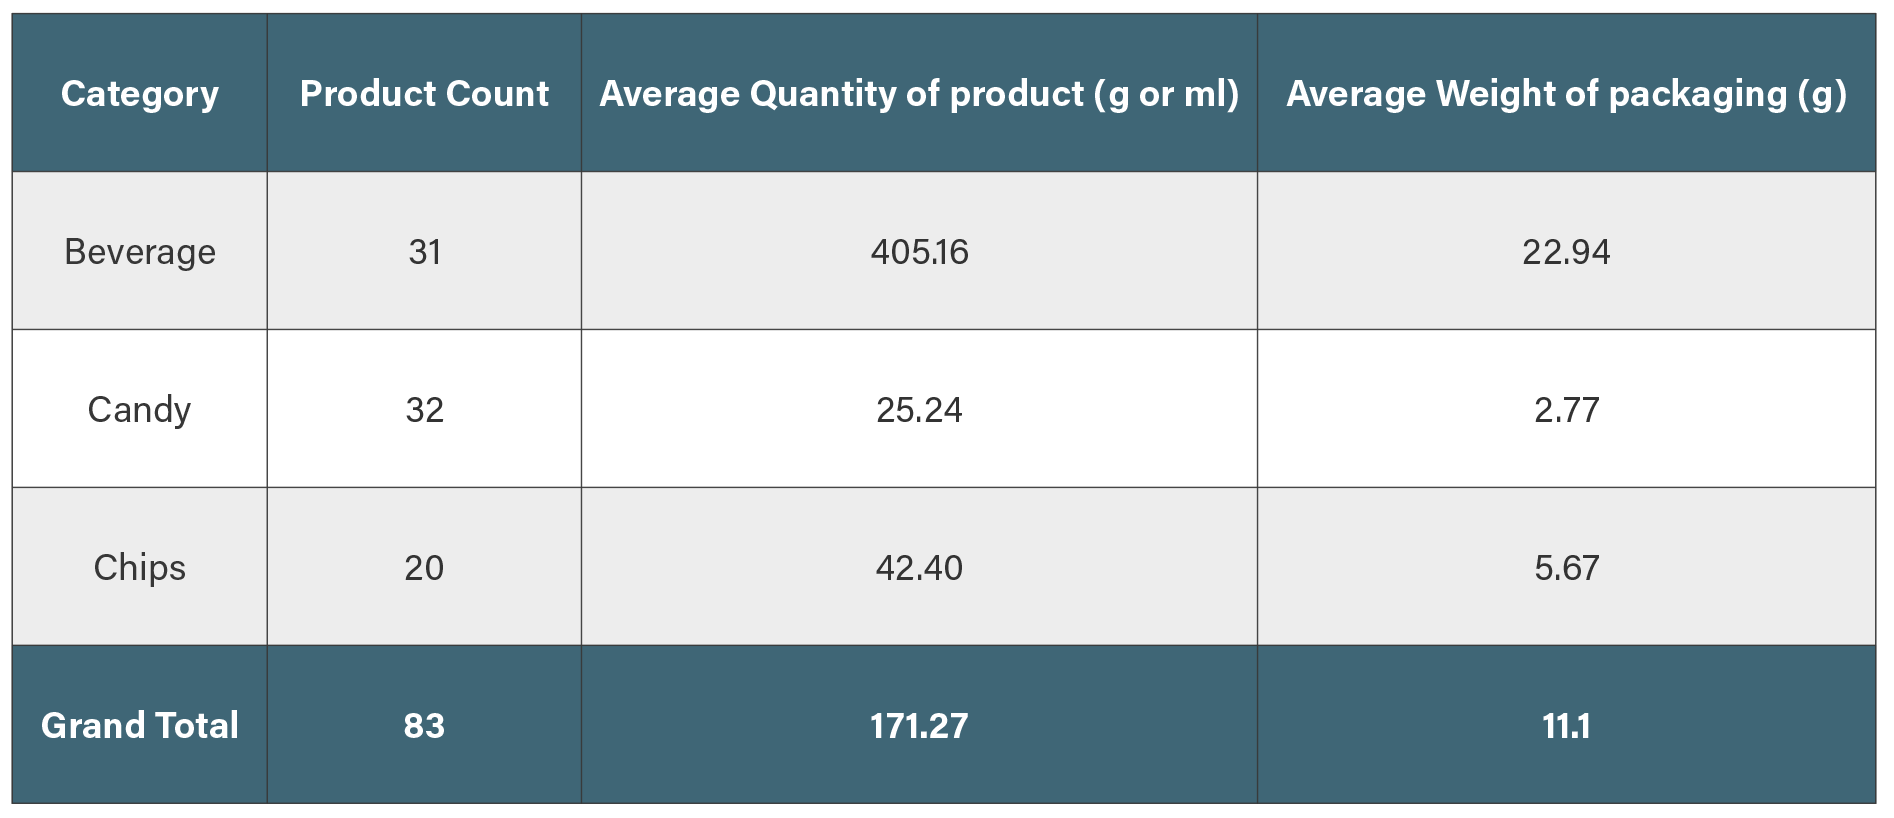
To characterize material types used in common consumer plastics, samples of common convenience and to-go items were obtained as described in the Input section. The LIP collected samples from stores and restaurants that were located in each of the nine 1 km2 transect areas where possible. Of the products sampled, 83 unique forms and brands were purchased to obtain packaging weights. The average weight of both the packaging and the product itself was collected for all samples (Table 4).
Table 4: Average weight of products and their plastic packaging for common convenience items
In total, 27 stores were sampled across the transects. 25 of the stores sampled were convenience stores and the remaining 2 were larger grocery stores. A total of 93 samples were taken across the categories of beverages, candy, chips, water, and tobacco. Compared to previous Urban Ocean CAP studies, the average weight of plastic packaging in Bangkok is heavier than plastic packaging found in cities like Can Tho, Vietnam; Panama City, Panama; and Semarang, Indonesia in all categories. Conversely, compared to the CAP study done in Melaka, Malaysia, only the average weight of plastic packaging for beverages was higher in Bangkok.
Considering the ratio of packaging to product (Table 4), chips had the highest packaging to product ratio with 0.13 g of packaging for every gram of product, compared to candy and beverages which had a ratio of 0.11 and 0.06 respectively. As such, chips were found to generate the most packaging waste per unit of product delivery of the three categories in this study. Compared to other CAPs, Bangkok’s packaging to product ratios are similar to previous chip packaging to product ratios observed usually around 0.09-0.12. Chips and candy almost always have the highest packaging to product ratios across product categories, except when sampling is expanded to include other regional/culturally specific convenience items such as wafers, biscuits, or yogurt.
Out of these samples, ~98% of convenience products were packaged in multilayer plastic film and PET. Chip and tobacco products were entirely packaged with multilayer plastic, and all beverages were packaged with PET. Multilayer film, of which 52.2% of the products sampled were made (Figure 8), is difficult and costly to recycle due to the varying characteristics that give it a low mass, such multi-material items can be difficult to recycle, as they contain not only different materials but a range of adhesives and additives (Moss 2017). Cigarettes and tobacco products were excluded from our purchasing of samples in this case, but all of those that were visually sampled were packaged in multilayer plastic.
The average weight of both the packaging and the product itself was collected for all of the 83 samples of top items from 18 grocery and convenience stores. Beverages, candy, and chips were sampled with the average weight of packaging of all samples being 11.1 g. Across the three product categories, the average weight of plastic packaging ranged from 2.77 g for candy to 22.94 g for beverages (Table 4). Beverage packaging had the most mass compared to chip and candy product packaging. This is largely due to the high density of beverage products and the higher density of PET found in packaging.
Figure 8: Material Breakdown of All Convenience Items
In addition to the convenience items, within each of the selected nine 1km2 transects in Bangkok, the LIP visited randomly selected food vendors and/or to-go restaurants to sample the food packaging and utensil types that were being distributed, totaling 27 restaurants and food vendors sampled. The LIP collected 108 to-go items from those vendors and documented their weight, material type, and brand, where possible. Out of all to-go meal packaging, 85% came packaged in an additional clear plastic film or an LDPE plastic bag (Figure 9).
Figure 9: Example of to-go food items packaged in single-layer plastic film bags
The majority of to-go items sampled were made of PP representing the most common material type identified for cold cups, straws, and utensils (Figure 10).
Plastic film was the most common material type identified for food containers and comprised around 13% of to-go items sampled in total (Table 5). Both of these material types can be difficult to collect and recycle and typically have a low value in the informal recycling sector.
A small but potentially growing subset of to-go items (12%) were organic materials such as paper or wood and a small fraction (2%) was also found to be compostable plastic, which requires industrial composting for effective end-of-life processing.
Figure 10: Material Breakdown of To-Go Items from Food Vendors and Restaurants
Table 5: Material type and average weight of common packaging items from food vendors
There are key opportunities in Bangkok to encourage and incentivize the use of material types that are compatible with existing formal and informal waste management systems. Similarly, there are problematic plastic items that have been identified, particularly single-use film plastic bags that often accompany to-go items, that could be targeted for elimination or replacement. Lightweight, complex, and difficult-to-recycle packaging materials such as multilayer plastic or multi-material canisters could be prioritized for redesign, EPR schemes, deposit models, and other interventions to minimize their likelihood of escaping the waste stream and ending up in the environment.
No items found.
CAP Results
:
Use
+
CAP Results: Use
+
To investigate the distribution and use of disposable plastics, material alternatives, and reuse options, the LIP surveyed 29 shops to determine the typical distribution of carrier bags to consumers. In January 2022, Thailand implemented a national ban on four single-use plastic items including thin plastic bags measure to reduce single-use plastic consumption outlined in Thailand’s Roadmap on Plastic Waste Management 2018-2030. The vision for this roadmap is to move towards a more sustainable future using a circular economy.
Despite the policy in place, 86% of the surveyed stores predominantly distributed single-use plastic shopping bags, with an average cost of 2 baht in the 56% of stores that charged for them. Violation fines for stores that do not comply have not been clearly communicated or enforced. Only 14% of the stores offered reusable alternatives to single-use plastic shopping bags, with an average cost of 33 baht (Figure 11).
It was clear from stakeholder interviews that the plasticx pollution associated with restaurants and food vendors, particularly plastic bags, is noticeable among community members.
Figure 11: Bag Survey from Convenience Stores & Food Vendors
During fieldwork, the convenience stores were sampled to determine the availability of alternatives across various product categories that usually consist of single-use plastics: household products, personal care items, picnicware, and staple goods. A survey of 29 convenience and grocery stores identified 115 single-use plastic alternative items dominated by bulk options (68.1%) followed by refillable alternatives (20.4%) (Figure 12). Bulk options indicate those where larger-than-average quantities are available for purchase in a single packaging unit, as opposed to individual or single serving quantities. On average, the alternative items were less expensive than their comparable single-use plastic items (Table 6, Table 7).
Figure 12: Material Breakdown of Single-Use Plastic Alternatives Available
When looking at kitchen products, there were only bulk and refillable types of alternatives. Bulk alternatives, although sometimes packaged in plastic, are listed as an alternative because they have a higher product-to-packaging ratio than their single-use plastic counterparts. These bulk products (cleaning wipes, dish soap, hand soap, household cleaner, laundry bleach, laundry detergent) had a lower cost difference for alternatives than their single-use plastic competitors (Table 6). Refillable household cleaners have a higher cost difference (19%) compared to the single-use competitor. Despite this, the four other refillable household products have a lower cost difference indicating a market for refillables in Bangkok that can expand in the future.
Table 6: Material Breakdown of Single-Use Plastic Alternatives Available
As seen in the alternative kitchen products, the alternative personal care items were also majority refillable and bulk (Table 7). Bulk products are a popular sight to see when shopping throughout Bangkok (Figure 13). Not only are they favorable in household and personal care items, but it was also found that buying staple goods- fruit juice, milk, and rice — in bulk is more cost-efficient. There were two instances where body wash had a reusable/refillable packaging alternative. These reusable items had a higher average cost difference for alternatives (13%) because it is designed to be used repeatedly decreasing the cost over increased usage.
Table 7: Alternative Personal Care Items Available
Figure 13: Examples of Bulk Products in Stores
All bioplastic picnicware alternatives- bowls, cups, and dinner plates — tended to be cheaper than or comparable in price to their single-use plastic picnicware counterparts. Bio-plastics are plastic materials produced from biomass sources. The use of bio-plastic alternatives aligns with the first step in Thailand’s Roadmap on Plastic Waste Management 2018-2030 which is reducing and replacing traditional single-use plastic by shifting towards “environmentally friendly” items (Enviliance ASIA), although replacing single-use with other single-use doesn’t decrease overall waste generation. Compostable alternatives could also be more circular if composting was available, however, they are not as popular, only found in straws, and have no cost difference compared to single-use straws.
Table 8: Alternative Picnicware Items Available
Some stakeholders interviewed also noted that there may be a transition going on in the city whereby more consumers are bringing their own items for reuse, which could be a positive sign.
“It has been noticed that people are becoming more environmentally conscious, making more of an effort to carry their own straws, cups, tote bags and using more refills.”
— Industry
The availability and affordability of bulk purchasing in Bangkok and the growing availability of plastic alternatives and reusables are a strong asset of the city’s economic fabric, and could be a critical step in moving the city to a more circular system. Bulk and refill options that are found to be successful in the city should be replicated and potentially expanded to other products or sectors.
No items found.
CAP Results
:
Collection
+
CAP Results: Collection
+
In 2023, an average of 8,775 tonnes of solid waste were collected per day in Bangkok. This demonstrated a decrease of 2.27% from 2022, which has been attributed to waste segregation and recycling initiatives, policies limiting single-use plastics, and economic influences that may reduce consumer waste (BMA Environment Department, 2024). In Bangkok, an average of 1.08 kg/capita/day is generated, which is higher than the regional average of 0.56 kg/capita/day and the global average of 0.74 kg/capita/day (Kaza 2018). The primary form of waste collection in Bangkok is via door-to-door services daily or every other day through the Bangkok Metropolitan Administration (BMA) and their 1,894 collection trucks (UNESCAP 2019) (Figure 14). It is important to note that municipal garbage collection crews only collect from accessible locations. Areas by canals are hard to reach by road and in turn dump their waste into the interconnected canal system in Bangkok (Kaza 2018). This contributes to the 88% collection rate in the city (UNESCAP 2019). It should also be noted that BMA deploys boats for waste collection for households along canals, where possible, and also deploys boats daily to collect floating waste in the Chao Phraya River (interviewees mentioned an average of 2-3 tons of waste collected from the rivers daily).
Figure 14: Waste Collection throughout Bangkok
The BMA collects waste from the 50 districts in Bangkok and transports it to the closest transfer station. The Sai Mai transfer station is located in Northern Bangkok and processes approximately 2,800 tonnes of waste/day, of which around 1,600 tonnes is sent to landfill and the remainder is sent to a mixed waste treatment system at Kanchanaburi province (RCities, 2024). In the East, the On Nut transfer station processes 2,600 tonnes of waste/day, the majority of which (~1,700 tonnes) is composted and the remainder is sent to landfill or Mechanical Biological Treatment (RCities, 2024). The largest transfer station is the Nong Khaem located on the West side of Bangkok which processes 3,600 tonnes of waste/day; around 2,700 tonnes of that waste goes to the landfill in the Nakhon Pathom province, while the remainder is sent to Waste-to-Energy (for RDF fuel) or Mechanical Biological Treatment (RCities, 2024; UNESCAP, 2019). Waste-to-energy plants have negative consequences because of associated GHG emissions and because they have no reuse or recovery of plastics for recycling. Urban Ocean partners recognize the need for implementable and circular solutions that hold plastics producers accountable for the full lifecycle of their products, cease the leakage of plastics into the environment, and incentivize reuse.
Outside of the door-to-door services, the BMA also employs over 9000 street sweepers to clean the streets of Bangkok. Additionally, there has been an introduction of 3R campaigns (reduce, reuse, recycle) to decrease the amount of waste sent to landfills and encourage waste separation. Despite this effort, only 8% of the population participates in waste separation (UNESCAP 2019).
There is no formal household recycling collection system, yet a very active informal recycling sector exists collecting a daily average of 2 tons of recyclable plastic waste close to the BMA’s daily average of 2.6 tons. Because of this, there is an opportunity to incorporate informal sector workers, who have extensive knowledge about the materials they encounter and may lose their livelihoods if recycling becomes more institutionalized. According to the UNESCAP report, four categories of informal recycling are present in Bangkok (UNESCAP 2019).
BMA crews: Separate recyclable plastics into separate bags during waste collection and sell the collected plastics to waste dealers located near one of the three transfer stations. (Table 9, Figure 15)
Salengs (informal waste collectors): Buy recyclables from households that separate their waste.
Street waste pickers: Pick out recyclables from public and residential waste bins.
Waste pickers at transfer stations: Sort through the solid waste and sell the recyclable materials found.
Table 9: Estimated avoided costs from collection of plastic waste in Sai Mai District and Sai Mai transfer station (source: UNESCAP, 2019)
Figure 15: Example of public recycling bins placed by BMA
Stakeholders interviewed believed that waste separation is critical, but also expressed concerns about costs associated with sorting and potential impacts on the informal waste sector.
“The problem is in the separation of waste, which makes the cost (of recycled plastic) higher.”
— Social Business
“Raise the price of recycled waste because there are many poor people who have to earn a living every day. If recycled waste is worth more, people will have more income and a job to collect waste so it doesn't fall on the road and in water sources.”
— Government
The city is investing in drop-off locations for recycling, but the inconsistency in the coloring and coding of the bins has reportedly been confusing. Additionally, due to the lightweight nature of plastic, many pieces may fly away even after being placed in the bin. Typically, households are required to pay a monthly fee to the BMA in order for officials to collect their waste on a set schedule. However, in reality, the officials will often collect waste even if the household does not pay, because the waste that is not collected creates a bad smell and causes inconvenience to the neighbors (Figure 16).
Figure 16: Bag of Recyclables
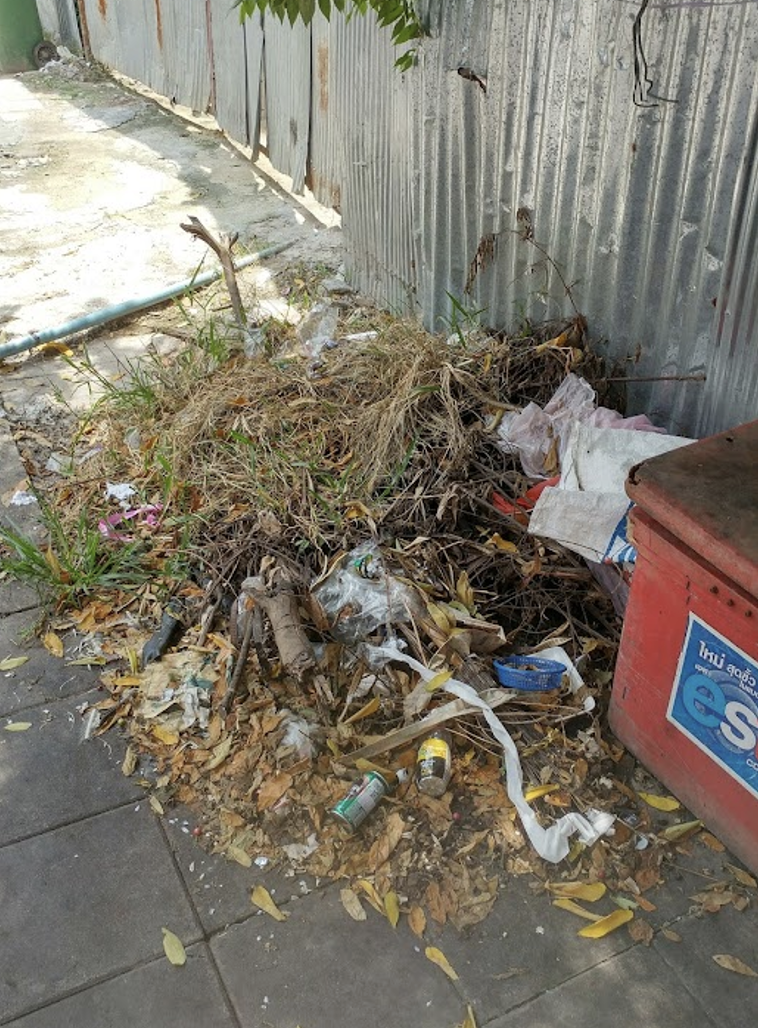
Given that certain areas receive curbside waste collection before waste is taken to transfer stations, there are opportunities for multiple points of intervention for material separation, whether it's at the household level, at the collection point, or at the transfer station. Lower-income communities are often located in areas with roads that are difficult for waste trucks to navigate, leading residents to engage in open dumping (Figure 17). Further research could explore the barriers to waste management participation across different social classes and examine how low-income populations in Bangkok are disproportionately burdened with waste disposal. There may be an opportunity to improve resident participation in waste management efforts by considering public infrastructure improvements, such as better road access, along with other social assistance measures.
Figure 17: Example of a Dump Site in the city
There are several innovative waste collection pilot programs in and around Bangkok. For example, the Federation of Thai Industries (FTI) and the Thailand Business Council for Sustainable Development (TBCSD) collaborated to co-found the Magic Hands Project x WON Project which has created over 300 drop-off locations for film plastic and plastic bags in Bangkok, Chonburi, and Rayong (TPBI, 2024). In the first phase of this project, collected plastics from 50 districts were used to produce 1,200 reflective work suits for street sweepers in Bangkok, and the next phase of the project includes refining the design for an additional 3,600 vests (BMA Environment Department, 2024). Precious Plastic also has operations in Bangkok and serves as an alternative plastic recycling location for the community whereby plastics can be converted directly into other products (PP, 2024). These types of programs that make recycling more accessible and available to the community and add value to potentially low-value plastic materials that may otherwise end up littered in the environment, could be a positive model for encouraging recycling in Bangkok and the surrounding areas.
No items found.
CAP Results
:
End of Cycle
+
CAP Results: End of Cycle
+
From the three transfer stations, the solid waste is sent to three landfills in the surrounding area. One is located in the Kamphaeng Saen District in Nakhon Pathom province, which processes 1,000 tons of waste daily from the Sai Mai Waste Transfer Station and 2,690.76 tons from the Nong Khaem Waste Transfer Station. Another landfill is located in the Phanom Sarakham District of Chachoengsao province, which receives 488.72 tons of waste daily from the On Nut Waste Transfer Station. The third landfill is located in the Huai Krachao district of Kanchanaburi province and receives 1,000 tons of waste daily from the Sai Mai Waste Transfer Station (RCities, 2024).
Informal waste collectors make money from selling recyclables. Items with the highest value- clear PET, HDPE, and PVC — are more likely to be recycled than lower-value recyclables. Waste pickers and salengs sell their recyclables to waste dealer shops, many of which are unlicensed. In 2014, it was estimated that 3,125 tonnes of recyclables/day were sold to waste dealers. The recyclable materials are pre-processed — sorted, cleaned, and compressed — before selling to official recycling facilities to maximize profit (UNESCAP 2019). There is an opportunity to increase recycling if the waste dealer shops were all licensed allowing for an increased flow of recycled materials from the informal to the formal sector.
Non-recycled plastic makes up 20% of the MSW composition (Figure 18). Bangkok’s top litter items include plastic bottles and plastic cups, both commonly made of PET, which can be easily recycled. The top litter category was plastic-related packaging. Of the to-go items sampled from restaurants and food vendors, 52.3% are packaged in PP seen in cold cups, food containers, and utensils. PP is not typically readily recyclable in residential systems, as households often do not clean and separate their to-go foodware and there is high contamination, though the city does have a drop-off location for PP that is sent to Zero Waste YOLO Co., Ltd. for upcycling, of the sellers for Precious Plastic Bangkok. Since households often do not clean spoons, forks, and food trays when consuming food packaged in PP plastic containers because it is inconvenient and difficult to clean, this causes PP plastic contaminated with food scraps to not enter the recycling process, even though PP can be recycled. However, if dry and clean PP plastic waste is collected, either through households or sorting/disposal methods, there are shops that buy this recycled plastic. The litter data highlights recyclable items that are not being captured and leak into the environment contributing to 1/5 the MSW composition being non-recycled plastic. Improved recycling infrastructure and convenient access to recycling bins are key to preventing recyclable materials from leaking into the environment.
Figure 18: 2017 MSW Composition in Bangkok (% weight)
(source: UNESCAP, 2021)
Bangkok is investing in additional measures of waste management. In 2016, the first waste-to-energy facility was built in the Nong Khaem district with the ability to turn 500 metric tons of waste into energy per day. This facility generates electricity used to support the operation of the Nong Khaem plant itself. There are plans to build two more facilities alongside On Nut and Sai Mai, each designed to process 1,000 tons of waste daily, which should be operational within the next three years (RCities, 2024). The waste-to-energy facilities will decrease the volume of solid waste sent to landfills. However, pollutants are emitted into the air during incineration posing health risks to the local community (Wachpanich 2022). Waste-to-energy plants have negative consequences because of associated GHG emissions and because they have no reuse or recovery of plastics for recycling. Urban Ocean partners recognize the need for implementable and circular solutions that hold plastics producers accountable for the full lifecycle of their products, cease the leakage of plastics into the environment, and incentivize reuse.
A compost facility that accepts food waste is located at the On Nut transfer station which processes up to 1200 tonnes/day (UNESCAP 2019). There is an opportunity to divert food waste, the largest MSW category, and other organic waste through composting. This could decrease solid waste volume by up to 50% saving landfill space and money (Figure 18). A decrease in greenhouse gas emissions would occur as composting rates increase since less waste will enter landfills where it emits methane.
No items found.
CAP Results
:
Leakage
+
CAP Results: Leakage
+
Litter transect locations were selected using a stratified random sampling method, in which transects were randomly selected in nine square kilometers which were distributed across three groups of population count (upper, middle, lower) based on LandScan ambient population data. Litter items were recorded using the open-source Marine Debris Tracker app.
In total, 1,888 litter items were recorded across 27 100m2 transects in nine different square kilometer areas sampled between April and May 2024. Across all surveyed transects, they are dominated by two types of litter: food-related plastic packaging, 40%, and tobacco products, 32% (Figure 19). Both of these items have limited to no recycling capabilities. Some interviewees expressed a potential lack of community concern for food-related plastic packaging which may contribute to the high amount found in the litter.
“As for plastic waste such as food packaging, snack bags, and food bags, no one cares about it, so there is no place to go and there is no systematic collection point.”
— Government
Figure 19: Material Breakdown of Litter Items
The top litter item (Figure 20) was dominated by plastic cigar/cigarillo tips made out of LDPE. This is similar to the UO cohort 1 cities where three out of the five had cigarettes as the top litter item. The amount of tobacco litter can be decreased by educating the public about the health risks associated with smoking and creating a culture of designated smoking areas that are equipped with waste bins for tobacco products. Straws were the second most common litter item and plastic grocery bags were the fifth most common. Both plastic straws and bags were banned as of 2022 in Thailand’s second phase of reducing single-use plastic products outlined in Thailand’s Roadmap on Plastic Waste Management 2018-2030 (Enviliance ASIA). There is an opportunity for straws and plastic grocery bags to move out of the top five most common litter items with the current ban in place. Plastic food wrappers were the third most found litter item and have limited recycling capabilities.
Despite PET plastic bottles being high-value recyclables in the informal sector (around 7-8 baht/kg), they are not being collected due to lack of recycling points in communities and a lack of incentive for consumers to bring them to waste separation points, making them the fourth most common litter item.
Incorporating the informal sector into Bangkok’s waste management would allow these items to be collected at higher volumes. Plastic cups are the eighth most common litter items. There is a large opportunity to recycle these items that tend to be made from PET. A system to capture the recyclable goods needs to be put in place. Metal bottle caps or tabs and plastic bottle caps are in the top 10 as the caps easily come unattached from the bottle. This can be addressed by adopting tethered caps on bottles as recently done by the EU. The other top 10 litter items consisted of trash bags and other food-related plastic which have limited recycling capabilities.
Figure 20: Most Common Litter Items (by count)
When aggregated across all surveys, Bangkok has an average litter density of 0.92 items per square meter (Table 10). The overall litter density was lower on average when compared to UO cohort 1 cities which ranged from 1 – 3.21 items per square meter. Litter density was highest in low-population areas (1.47 items/m2) and lowest in middle-population areas (0.33 items/m2), but common plastic items (including food plastic, plastic fragments, other plastic, PPE, and personal care items) comprised around 52% of litter items, which is relatively high when compared to other UO cities. There is variation in litter density between the three population tertiles.
Table 10: Litter Density and Top Litter Items from All Transects
Regardless of the population density, the most common litter material types were tobacco products and food-related plastic packaging. Tobacco products were higher in upper population density transects while food-related plastic packaging was significantly in the middle population density transects (Figure 21). In all nine transects, plastic cigar and cigarillo tips, straws, and plastic food wrappers consistently rank among the top five most common litter items across various population densities.
Figure 21: Proportion of most common material types among litter in lower (inner), middle (middle), and upper (outer) population count areas
The litter in Bangkok could travel down the main watershed into the Chao Phraya River. The river measures 372 km (231 mi) long and goes through the middle of Bangkok into the Gulf of Thailand. Bangkok evolved from a canal-based settlement, utilizing the Chao Phraya's waters to create convenient transport routes, and currently has over 1600 canals and waterways in which litter can enter (Clean Currents Coalition, 2023) (Figure 22).
Figure 22: Example of litter found in canals and storm drains in Bangkok
As the river courses through Bangkok and eventually empties into the Gulf of Thailand, it accumulates large quantities of plastic waste. The Chao Phraya River has an estimated 385,300 kg of plastic emissions per year (The Ocean Cleanup, 2023). This buildup chokes the river along its path, severely impacting both the surrounding communities and the river’s ecosystem, and it further exacerbates issues of flooding and clogging when there is heavy rainfall. There are efforts to clean up as well as recycle collected plastics in Bangkok's waters through groups like the TerraCycle Thai Foundation or The Ocean Cleanup.
“It is not separated for recycling, especially small pieces of plastic that float and clog the pipes. When it rains, it floods because the waste gets stuck in the pipes, making it difficult to reach. The sidewalks are flooded.”
— Government
As the Chao Phraya nears the sea, much of the plastic waste it carries has broken down into microplastics, defined as pieces smaller than five millimeters, making them invisible to the naked eye. Microplastics threaten marine life by serving as non-degradable carriers of harmful contaminants and heavy metals that will likely create chronic toxic effects (Brennecke et al., 2016). Research done on shrimp harvested from a freshwater pond in the central region of Thailand shows the presence of microplastics in their intestine, which could pose health risks to humans and potentially higher trophic species (Reunura T. & Prommi TO., 2022). This further emphasizes the need to prevent waste in Bangkok from entering the environment upstream.
No items found.
Opportunities
+
We recommend exploring the following opportunities to expand and enhance circularity in Bangkok based on the findings of this report. These opportunities are categorized based on the seven spokes of the CAP model and are roughly listed based on the level of potential impact to reduce plastic waste in Bangkok within each spoke. The purpose of the accompanying Opportunity Assessment Workshop in Bangkok as part of Urban Ocean is for the city to further prioritize these opportunities based on impact, feasibility, and cost. Ultimately, Bangkok will have an opportunity chosen and developed as part of Urban Ocean and will have a Project Statement detailing the roadmap to implementation. It is important to note that the opportunities listed below are individualized based on the findings, but solutions cannot happen in a vacuum and are most impactful when strategically combined within a holistic system framework.
INPUT
Local and regional EPR schemes should be explored between companies and the governments of the ASEAN region, particularly among the most common local brands.
There may be opportunities for local deposit return schemes for brands with local or regional manufacturing locations.
Explore opportunities for private sector funding from popular local or regional/national brands to reduce, reuse, recycle waste.
COMMUNITY
Local and regional EPR schemes should be explored between companies and the governments of the ASEAN region, particularly among the most common local brands.
There may be opportunities for local deposit return schemes for brands with local or regional manufacturing locations.
Explore opportunities for private sector funding from popular local or regional/national brands to reduce, reuse, recycle waste.
PRODUCT DESIGN
Problematic to-go items such as LDPE plastic bags should be targeted for substitution and transition to alternative materials that are recyclable in local markets or can be reused.
Lightweight, complex, and difficult-to-recycle packaging materials such as multilayer plastic or multi-material canisters should be prioritized for redesign, EPR schemes, deposit models, and other interventions to minimize their likelihood of escaping the waste stream and ending up in the environment.
Encourage transition towards organic to-go materials in restaurants by highlighting them in the community / providing incentives.
USE
Reduce single-use plastic by encouraging the use of reusable straws, stainless steel bottles, travel cups, etc. — especially in restaurants and food vendors — either through policy/incentives, city-based communication campaigns, or both.
Stores should explore incentives for customers to bring reusable bags, particularly those that can simultaneously save costs for the stores.
The local government should explore policy options and incentives to discourage single-use plastic shopping bags.
Stores, consumers, marketers, and local government should capitalize on cost-effective bulk, refillable, and alternative options already present in the city, and expand where there is demand and opportunity.
COLLECTION
Encourage households and communities to separate recyclables at source so that they are not contaminated with food/organic waste and can be recycled.
Provide accessible recycling drop-off locations so they are common across the city.
Incorporate and center informal sector workers who know the most about the types of materials they encounter and who may lose their livelihoods if recycling becomes more institutionalized.
Increase the amount of food waste being sent to the composting facility, as it could divert up to 44% of MSW — this could be accomplished through collection or education efforts.
Explore alternatives in dense settlements where access to households for waste collection is a concern to avoid open dumping in the canals/sub-canals.
END OF CYCLE
Raise the price of recycled waste (enhance end-markets and increase the quality of sorted waste) — e.g., there may be an opportunity to increase recycling if the waste dealer shops were all licensed, allowing for an increased flow of recycled materials from the informal to the formal sector.
Need waste management pathways for all waste streams.
Multiple points of intervention exist to enhance material separation — from household to collection point, during collection, and at the transfer stations.
Linking public infrastructure (e.g., road access) and other social assistance to opportunities to improve participation in waste collection and management, where feasible and considering creative solutions for densely populated settlement areas where access is an issue.
Conduct further research on barriers to waste management participation, as well as how low-income populations in Bangkok are disproportionately tasked with disposing of waste. This could include exploring non-conventional methods of collection, such as cargo bicycles, push carts, or other participatory methods using designated drop-off zones.
LEAKAGE
Food-related packaging should match local infrastructure (e.g., incentivizing recyclable or compostable items), with support from local policy and incentives for businesses.
Explore increasing cigarette/tobacco collection bins across the city (and/or in targeted areas where tobacco litter rates are particularly high) and encourage their proper disposal through education campaigns and increased disposal infrastructure.
Encourage redesign so that bottle caps are tethered to bottles in order to eliminate bottle caps from the top 10 litter items.
Use ambient population density and other societal indicators to determine the best locations for drop-off centers to decrease leakage, starting with low-population areas that had the highest litter densities.
Adelina, C. and Archer, D. (2024). A situated urban political ecology of plastics recycling in Bangkok, Cities, Volume 145, 2024, 104671, ISSN 0264-2751, https://doi.org/10.1016/j.cities.2023.104671.
Brennecke, D., Duarte, B., Paiva, F., Caçador, I., & Canning-Clode, J. (2016). Microplastics as vector for heavy metal contamination from the Marine Environment. Estuarine, Coastal and Shelf Science, 178, 189–195. https://doi.org/10.1016/j.ecss.2015.12.003
Kaza, S., L. Yao, P. Bhada-Tata and F. Van Woerden (2018). What a Waste 2.0: A Global Snapshot of Solid Waste Management to 2050. Urban Development Series. Washington, DC, World Bank.
National Statistic Office, & United Nations Thailand. (2024). Bangkok Population Growth. Bangkok population 2024. https://worldpopulationreview.com/world-cities/bangkok-population
Nguyen, T. P. L., & Pattanrsi, S. (2022). The Influence of Ethnic, Social, and Demographic Factors on Urban Slum Dwellers' Threat Appraisal, Awareness, and Protective Practices against COVID-19 in Thailand. The American journal of tropical medicine and hygiene, 107(1), 169–174. Advance online publication. https://doi.org/10.4269/ajtmh.21-1096
Reunura T, Prommi TO. 2022. Detection of microplastics in Litopenaeus vannamei (Penaeidae) and Macrobrachium rosenbergii (Palaemonidae) in cultured pond. PeerJ 10:e12916 https://doi.org/10.7717/peerj.12916
The Ocean Cleanup. (2023, September 1). River plastic pollution sources. RIVER PLASTIC EMISSIONS TO THE WORLD’S OCEANS. https://theoceancleanup.com/sources/
UNEP (2018). "Legal Limits on Single-Use Plastics and Microplastics: A Global Review of National Laws and Regulations."
The rich text element allows you to create and format headings, paragraphs, blockquotes, images, and video all in one place instead of having to add and format them individually. Just double-click and easily create content.
Static and dynamic content editing
A rich text element can be used with static or dynamic content. For static content, just drop it into any page and begin editing. For dynamic content, add a rich text field to any collection and then connect a rich text element to that field in the settings panel. Voila!
How to customize formatting for each rich text
Headings, paragraphs, blockquotes, figures, images, and figure captions can all be styled after a class is added to the rich text element using the "When inside of" nested selector system.